Tesamorelin exposure in an HIV pharmacokinetic study: when a blood draw sits on the curve
A concentration measured shortly after an intervention can differ greatly from one measured later.
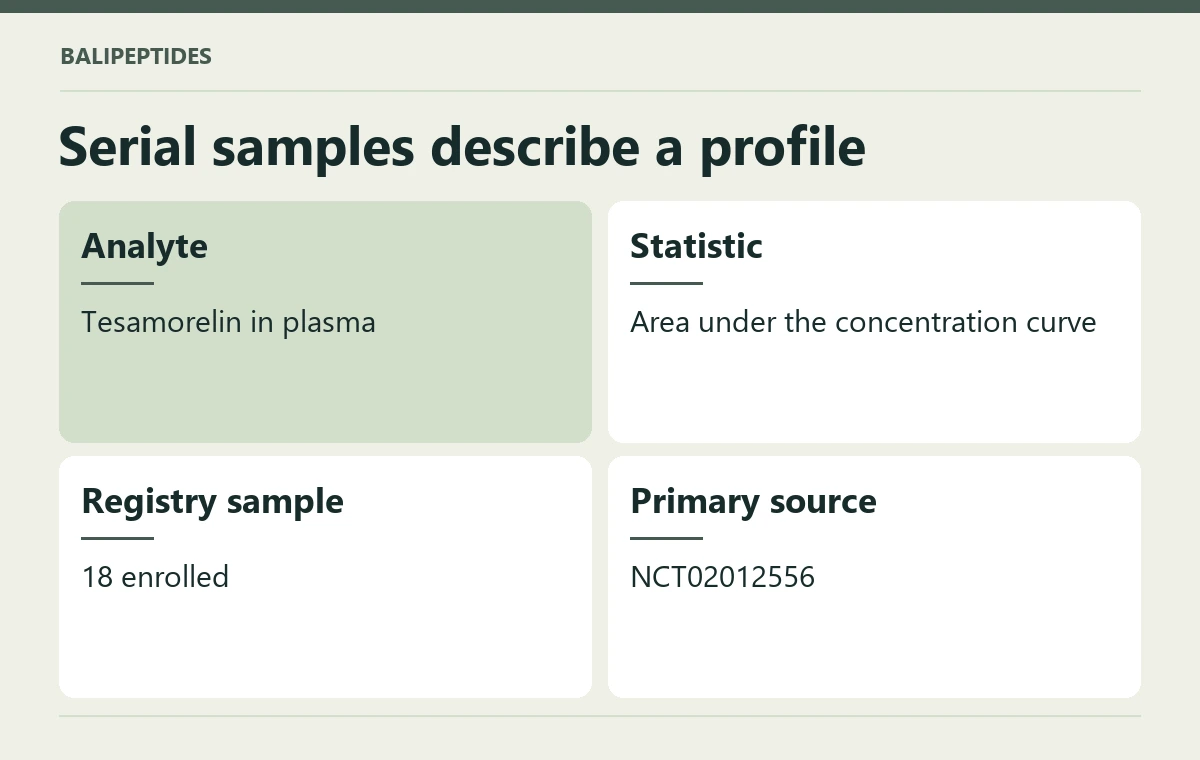
A concentration measured shortly after an intervention can differ greatly from one measured later. A pharmacokinetic study of TH9507 in HIV-positive participants specified serial plasma sampling and an exposure calculation. Its primary endpoint concerns circulating tesamorelin, not the amount of visceral fat or a waist measurement.
Serial samples describe a profile
To read a figure, first identify whether the horizontal axis shows minutes after a particular administration or days since the start of a study. The same participant can appear repeatedly on each axis for different reasons. A pre-intervention value, an observed peak and an overall area under the curve describe different features. If a report mentions adverse events, keep those counts separate from the concentration graph. A serial-sampling protocol does not give personal instructions for a catalogue pen.
Read the shape of an exposure curve
Two samples labelled “after tesamorelin” are poor comparisons if one was drawn close to administration and the other hours later. Copy the interval between administration and collection onto the same line as the value. If the interval is missing from a screenshot, the original table or figure is worth finding before comparing the numbers.
Repeated sampling on more than one study day can address whether exposure differs across the protocol. A sample taken before the study intervention on a later day has a different context from the first baseline sample. Reading the day, the time after administration and the measured substance together avoids comparing two points simply because both have the same concentration unit.
Participant and measurement details
- People in the record: 18 (actual enrollment). Eligible ages: 18 years to 65 years.
- Clinical setting: HIV.
- Named study interventions: Tesamorelin.
- Study design: phase 1, interventional, single group.
- Measured here: The area under the tesamorelin plasma concentration curve.
- Research locations listed in the record include: Montreal, Canada.
- Study calendar in the registration: start 2008-05; primary completion 2008-07.
- Primary record: Theratechnologies. ClinicalTrials.gov, NCT02012556.
The Tesamorelin retail listing in Bali identifies a 32 mg pen. To compare it with this study, look beyond the common drug name to the formulation and route. Neither a total pack amount nor a single laboratory concentration can replace the study's full exposure calculation.
