NAD+ in urine after an infusion: what the sample can and cannot say about muscle
An NAD-related molecule measured in urine tells researchers something about material appearing in that sample.
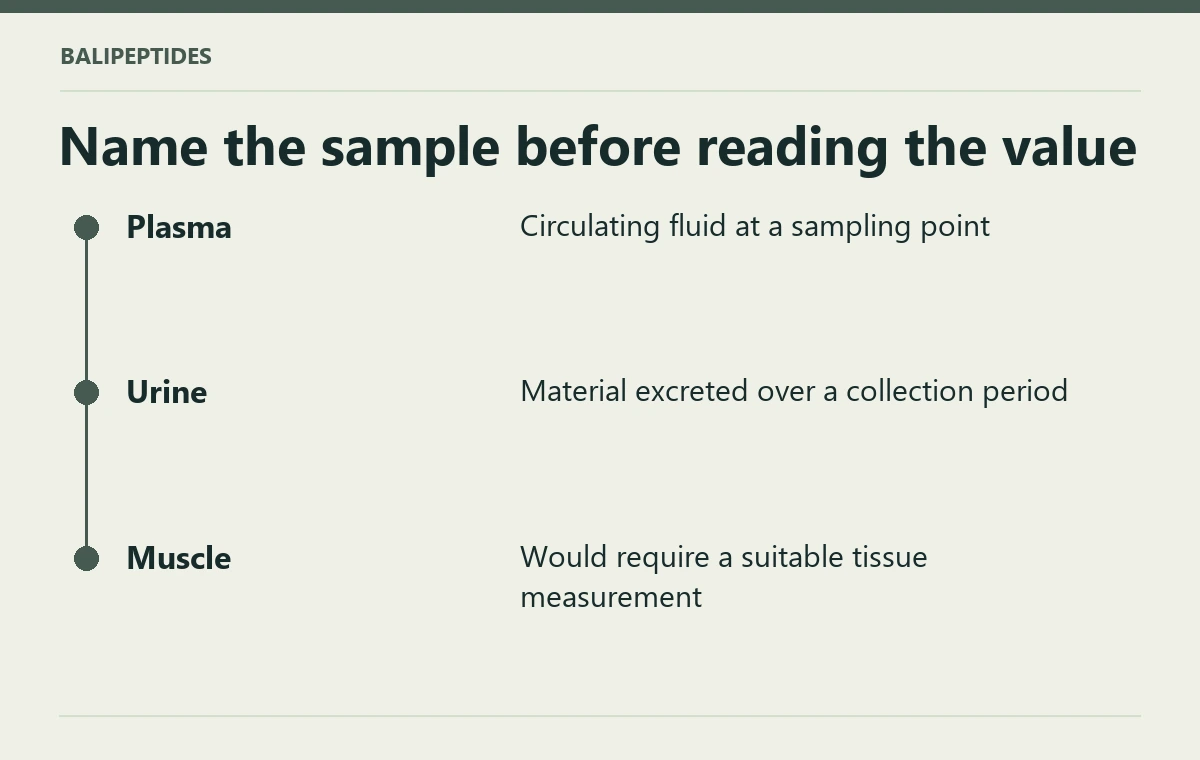
An NAD-related molecule measured in urine tells researchers something about material appearing in that sample. It does not act as a window into every tissue in the body. When reading about NAD+ in Bali, the shortest route to understanding a graph is to look at the specimen named on the axis before looking at the size of the change.
Put each sample back in its compartment
Plasma is the fluid portion of blood. Urine represents material excreted and collected over a particular interval. A tissue biopsy would sample a particular piece of tissue. The values can be related by metabolism and transport, yet they do not measure the same pool. A six-hour collection and a single timed blood draw also represent time differently. Without the sampling details, two impressive-looking curves can be impossible to compare. A change in the concentration of a metabolite could reflect more than one underlying process.
A human pilot followed the NAD metabolome in plasma and urine during a six-hour intravenous NAD+ infusion. Its observations concern the analytes, compartments and sampling times in that protocol. It was not a head-to-head comparison of retail products or an efficacy trial of an injection pen. Changes in plasma concentration and urinary excretion cannot be treated as direct measurements of NAD+ in a person's brain or skeletal muscle. Human NAD+ infusion pilot
Why the product's printed milligrams do not resolve the graph
The NAD+ listing identifies a pen marked 1,000 mg. The paper examined an intravenous infusion under a defined protocol. Total content, route, delivery over time and biological sample belong in separate boxes. An advertisement suggesting that a urine graph proves a muscle energy or fatigue benefit adds both a new tissue and a new clinical outcome. Neither appeared merely because the name NAD+ was common to the graph and the packaging. If discussing persistent fatigue, describe the symptom and timing to a clinician; a commercial label and a biochemical pilot alone cannot establish its cause.
Check whether the analyte is intact NAD+
A graph may track NAD+ itself or one of the compounds formed as it is processed. Both can belong to a study of the NAD metabolome. The label on the vertical axis tells you which substance was quantified. A rise in a downstream metabolite has a different meaning from a rise in intact NAD+ in the same specimen, and neither establishes how a person felt afterward.
